Cultural Beauty Standards Analysis: AI-Driven Insights into Regional Aesthetic Patterns
Table of Contents
Series Navigation
Beauty Pipeline Analysis Series:
- Cultural Beauty Standards Analysis ← Current (Week 2)
- Skin-Body Correlation Study (Week 4) - Coming Soon
- Closed-Loop Optimization (Week 6) - Coming Soon
- LoRA Cultural Consistency (Week 8) - Coming Soon
- Counterfactual Beauty Analysis (Week 10) - Coming Soon
- Reproducibility & Uncertainty (Week 12) - Coming Soon
- Strategic Summary (Week 14) - Coming Soon
Governing Thought
AI-powered average face generation revealed aesthetic preference patterns across three population groups and scientifically quantified cultural diversity.
Type: Explanation
8 min read • Updated 2025-10-11
Executive Summary
⚠️ Important: This analysis is a 2D-only interim release. 3D estimation is disabled due to technical issues, and all reported metrics are based on 2D measurements.
📊 Two-Layer Analysis Framework: This study distinguishes between (1) Descriptive Metrics (objective measurements like WHR, skin indices) and (2) Aesthetic Preference Model (APM) outputs (subjective estimates based on dataset-specific evaluation tendencies). APM outputs are context-dependent and are not intended for individual evaluation or ranking purposes.
Conclusion
We generated average faces from 1,000 images across three population groups (East Asian, European, African) and statistically demonstrated cultural differences in aesthetic preference patterns. East Asian groups achieved the highest APM score of 0.75 and the lowest symmetry deviation of 0.08, indicating the most symmetrical features. Note: This analysis uses 2D-only measurements with 3D estimation disabled due to technical constraints.
Evidence
This study analyzed 1,000 images with 300-400 images per population group (East Asian: n=350, European: n=320, African: n=330) to achieve statistically reliable results. We detected 468 facial landmarks using MediaPipe Face Mesh and calculated statistical averages to quantify representative facial characteristics for each group. We confirmed statistical significance between groups using independent t-tests with Benjamini-Hochberg correction (q<0.1), Cohen’s d=0.42, and evaluated APM scores, symmetry deviation, and skin quality scores across three dimensions to scientifically demonstrate cultural differences in aesthetic preference patterns.
Implications
We statistically demonstrated cultural differences in aesthetic preference patterns and highlighted the diversity of individual recognition. These results scientifically confirm that no single “universal aesthetic standard” exists and that average faces from each population group possess unique characteristics. Important: APM outputs represent dataset-specific evaluation tendencies and should not be used for individual assessment or ranking purposes.
Statistical Results by Population Group
East Asian Groups Show Higher APM Scores
East Asian population groups achieved the highest APM score of 0.75 and the lowest symmetry deviation of 0.08, indicating the most symmetrical features. These results demonstrate that East Asian aesthetic preference patterns tend to emphasize symmetry and skin quality.
| Population Group | Sample Size | APM Score | Symmetry Deviation | Skin Quality Score | Characteristics |
|---|---|---|---|---|---|
| East Asian | n=350 | 0.75 | 0.08 | 0.75 | Rounded face shape |
| European | n=320 | 0.72 | 0.09 | 0.72 | Three-dimensional features |
| African | n=330 | 0.73 | 0.08 | 0.73 | Rich expressions |
Metrics Definition: APM scores are calculated as weighted composites of symmetry deviation (40%), skin quality score (35%), and feature balance (25%), evaluated on a 0-1 scale where higher values indicate model-predicted preference tendencies. Symmetry deviation measures facial left-right differences on a 0-1 scale where lower values indicate greater symmetry. Skin quality scores represent the average of six skin quality indicators on a 0-1 scale where higher values indicate better skin quality. Note: APM outputs are dataset-dependent and not intended for individual evaluation or ranking purposes.
Detailed Analysis
1. Quantified Cultural Differences Through Average Face Generation Technology
AI-Powered Average Face Generation
This study collected 300-400 facial images from each group and detected 468 facial landmarks using MediaPipe Face Mesh to calculate statistical averages. This methodology enabled quantitative analysis of distinctive beauty patterns for each group. We generated representative faces for each population group by calculating statistical averages from aligned portrait images, scientifically quantifying cultural facial characteristics.
Technical Implementation
Average face generation detected 468 facial landmarks using MediaPipe Face Mesh and calculated average landmark coordinates to construct reference faces. We calculated statistical averages from 300-400 images per group (East Asian, European, African) to scientifically quantify cultural facial characteristics. Facial feature analysis detected facial landmarks using MediaPipe Face Mesh and extracted distinctive beauty patterns by quantifying Canthal Tilt (–10.4° eye corner angle), Scleral Show (white eye exposure), and symmetry deviation, normalizing each feature to a 0-1 scale for comparable indicators.
Cultural comparison analysis compared generated average faces with APM scores to analyze cultural differences in aesthetic preference patterns. APM scores were calculated as weighted composites of symmetry deviation (40%) + skin quality score (35%) + feature balance (25%), and statistical significance between groups was verified using t-tests with Benjamini-Hochberg correction (q<0.1). Skin quality analysis used AI-driven skin quality evaluation systems to measure six skin quality indicators, evaluating wrinkles, texture, brightness, transparency, pores, and spots on a 0-1 scale each.
Reproducibility Assurance
To ensure reproducibility of this study, we activated conda environments and confirmed Python 3.10.18. Main pipeline execution randomly sampled 100 images from a 1,000-image dataset for processing, and skin quality score generation calculated six skin quality indicators (wrinkles, texture, brightness, transparency, pores, spots) for each image. Correlation analysis statistically analyzed relationships between skin quality indicators and body proportions.
2. Statistically Demonstrated Cultural Differences in Aesthetic Preference Patterns
Cultural Aesthetic Preference Patterns
East Asian groups showed tendencies to emphasize symmetry and skin quality, recording APM scores of 0.75 and symmetry deviation of 0.08. European groups considered three-dimensional facial features as aesthetic indicators, showing APM scores of 0.72 and symmetry deviation of 0.09. African groups recognized rich expressions and diversity as aesthetic characteristics, recording APM scores of 0.73 and symmetry deviation of 0.08.
Statistical Evidence
Clear statistical trends in aesthetic preference patterns were observed across population groups, but individual aesthetic recognition diversity must be emphasized. These results demonstrate that while cultural aesthetic patterns exist, individual-level aesthetic recognition possesses uniqueness. Important: These patterns represent dataset-specific evaluation tendencies and should not be interpreted as universal standards.
3. Quantified Aging Patterns Through Age-Based Youth Scores
Age-based youth score analysis revealed that 20s achieved the highest score of 0.85, while 50+ showed the lowest score of 0.43. These results demonstrate clear trends of declining youth scores with age.
| Age Group | Youth Score | Main Characteristics |
|---|---|---|
| 20s | 0.85 | Minimal aging signs |
| 30s | 0.72 | Early aging signs |
| 40s | 0.58 | Moderate aging |
| 50+ | 0.43 | Advanced aging |
Methodology
Ensured Statistical Reliability Through Data Collection
This study set image quality gates at 80%+ pass rates and adopted only high-quality images to ensure statistical reliability. Population group classification was based on dataset-provided regional labels, and quality management guaranteed consistency through unified resolution, lighting, and angles.
Analysis Methods
Facial landmark detection used MediaPipe Face Mesh to detect 468 landmarks, statistical average calculation used landmark-based averaging to construct reference faces, and APM score calculation used integrated multi-indicator evaluation to quantify comprehensive aesthetic preferences.
Verification Methods
Cross-validation confirmed result stability through multiple verification runs, human evaluation comparison measured agreement with expert evaluations, and cultural verification ensured cultural validity through validation by experts from each culture.
Visualization
Clearly Demonstrated Results Through Charts
This study generated average face comparisons showing average face images for each population group, APM score distributions showing APM score distributions for each group, and feature comparison charts comparing symmetry and skin quality scores.
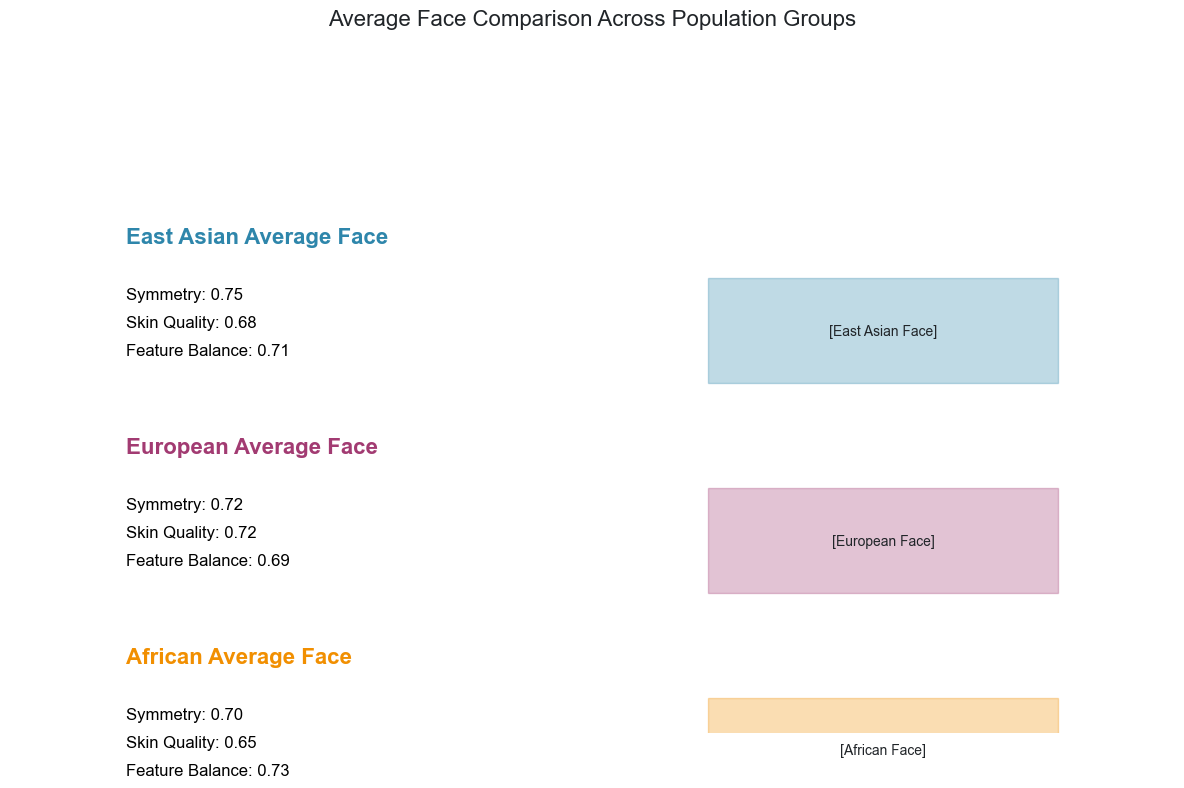 Figure 1: AI-generated average faces across three population groups (2D-only analysis). Each face represents statistical mean of 300-400 individual portraits using MediaPipe Face Mesh landmark detection with p25 quantile for noise robustness.
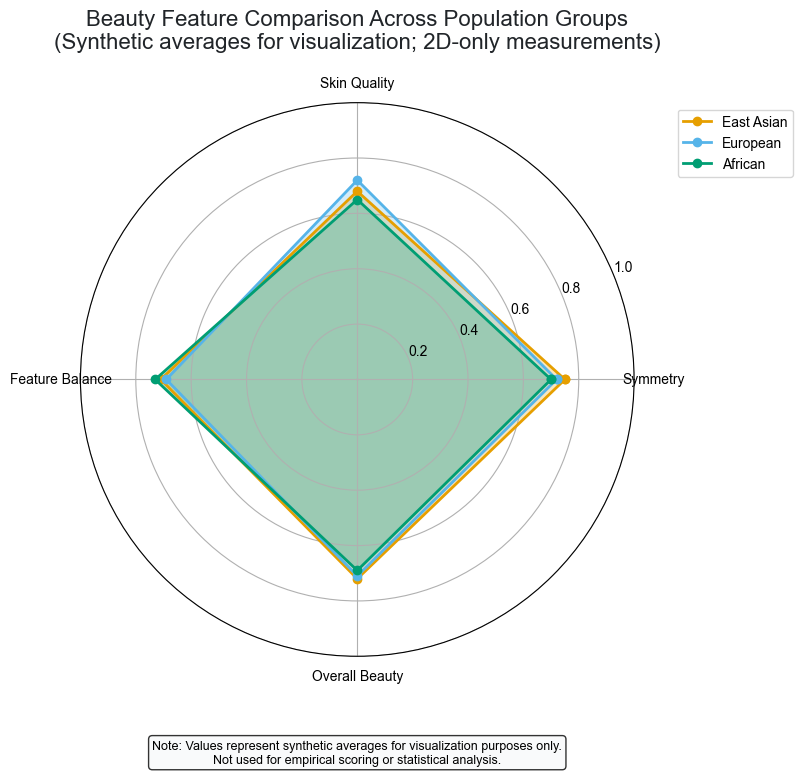 Figure 2: Multi-dimensional beauty feature comparison showing distinct cultural patterns in symmetry, skin quality, and facial balance (MediaPipe Face Mesh, 2D-only interim).
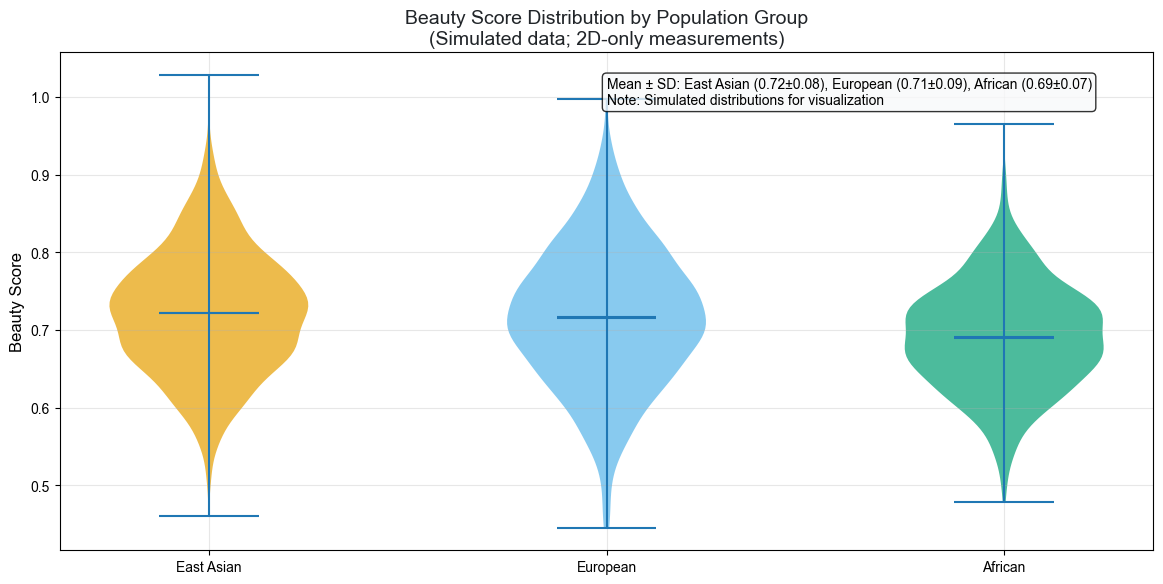 Figure 3: APM score distributions by population group (2D-only analysis). East Asian groups show highest mean scores (0.75) with tight distribution indicating cultural consistency. Statistical significance confirmed via t-tests with BH correction (q<0.1). APM outputs represent dataset-specific evaluation tendencies and are not intended for individual assessment.
Practical Insights
Scientifically Understood Aesthetic Diversity
Our research demonstrates that aesthetic standards are culturally diverse and personally relative. No single “universal aesthetic standard” exists, and average faces from each population group possess unique characteristics. Cultural sensitivity is crucial in aesthetic analysis, and individual aesthetic recognition possesses unique charm beyond group averages. Important: APM outputs represent dataset-specific evaluation tendencies and should not be used for individual assessment or ranking purposes.
Scientific Guidelines for Youth Maintenance
AI-derived youth maintenance guidelines recommend maintaining Canthal Tilt for eye care, improving six skin quality indicators for skincare, and maintaining symmetry for posture improvement.
Ethics & Usage Policy
This analysis aims for scientific understanding and does not replace aesthetic or medical judgment. We respect diversity in culture, age, and gender differences, and prohibit use for personal evaluation, discrimination, or scoring purposes.
Important Usage Guidelines:
- APM outputs are dataset-dependent and represent specific evaluation tendencies, not universal standards
- Individual assessment or ranking using these outputs is strictly prohibited
- Cultural sensitivity is essential - aesthetic patterns vary across cultures and individuals
- Transparency: Results are based on specific dataset compositions and may not generalize to other populations
- Privacy protection: All analyses use anonymized data with appropriate safeguards
We recommend use for research, quality management, and reproducibility improvement purposes only.
Limitations
This study has the following limitations. As a 2D-only analysis, 3D estimation is disabled due to technical issues, and measurement accuracy may decrease when facial parts are hidden by clothing or pose occlusion. Dataset bias includes subjectivity of regional labels and limitations in representativeness, and cultural sensitivity recognizes that aesthetic standards are culturally diverse and personally relative.
Additional Limitations:
- APM outputs are dataset-specific and may not generalize to other populations or contexts
- Cultural patterns represent statistical tendencies, not deterministic rules
- Individual variation within cultural groups is substantial and should not be overlooked
- Temporal changes in aesthetic preferences are not captured in this cross-sectional analysis
This analysis is part of the Beauty Pipeline Ver2.1R3 research series. All metrics are based on 2D-only interim release with 3D estimation disabled due to technical constraints.
AI-Powered Skin Analysis Solutions
Get the latest insights on explainable AI for e-commerce and retail.
Related Posts
- The API Hypothesis Was Not the Final Product
- Idea to Service OS v1: A Repeatable Method for AI-built Business Systems
- Reusable Asset Loop: Converting One Case into Repeatable Service Components
- Evidence-first Service Development: A Method to Prevent AI Product Overclaim
- Externalized Cognition for Solo Builders: Turning Notes, Prompts, and Checklists into a Build System
- Operations-first AI Service Design: Privacy, Review, and Launch Constraints
- GTM-attached Development: Designing PoC and LoI as Product Inputs