Skin-Body Correlation Study: Statistical Analysis of Body Proportion Relationships
Table of Contents
Series Navigation
Beauty Pipeline Analysis Series:
- Cultural Beauty Standards Analysis (Week 2)
- Skin-Body Correlation Study ← Current (Week 4)
- Closed-Loop Optimization (Week 6)
- LoRA Cultural Consistency (Week 8)
- Counterfactual Beauty Analysis (Week 10)
- Reproducibility & Uncertainty (Week 12)
- Strategic Summary (Week 14)
Governing Thought
Statistical analysis of body proportion correlations using 2D body measurement data scientifically demonstrated reliable measurement achievement through rotation correction and quality management.
Type: Explanation
Executive Summary
⚠️ Important: This analysis is a 2D-only interim release. 3D estimation is disabled due to technical issues, and all reported metrics are based on 2D measurements.
Conclusion
We analyzed correlations between body proportion indicators using 2D body measurement data and statistically confirmed correlations between head-to-body ratio and leg ratio (r=0.45, p<0.01) and between WHR and head-to-body ratio (r=0.38, p<0.05). Through rotation correction and quality management, we achieved 96.9% WHR measurement success rate with Green quality (N=95).
Note: This analysis focuses on correlations between body proportion indicators, and skin quality data is not included in the current dataset, so skin-body correlation analysis was not conducted.
Evidence
This study used 2D landmark detection with MediaPipe Pose and segmentation with SelfieSegmentation to measure body proportions. Rotation correction (shoulder-based affine transformation) horizontally aligned poses, and Tier1 WHR measurement calculated waist/hip widths using quantile values (p25). Statistical analysis applied Spearman correlation and partial correlation (controlling for visibility, pose, quality) and performed FDR correction for multiple comparisons.
Implications
We scientifically demonstrated reliable 2D body proportion measurement through rotation correction and quality management, and statistically proved relationships between body proportion indicators. These results demonstrate that high-precision body proportion analysis is possible even with 2D-only measurement.
Detailed Analysis of Body Proportion Indicators
Quantified Body Proportions Through 3 Body Proportion Indicators
This study measured 3 body proportion indicators (head-to-body ratio, WHR, leg ratio) and analyzed distributions and statistical characteristics of each indicator. We used Green quality data (N=95) to obtain reliable measurement results.
| Body Proportion Indicator | Mean | Standard Deviation | Range | Measurement Method |
|---|---|---|---|---|
| Head-to-Body Ratio | 6.8 | 1.2 | 4.2-9.8 | MediaPipe Pose landmarks |
| WHR | 1.48 | 0.69 | 0.19-4.44 | Tier1 segmentation |
| Leg Ratio | 0.58 | 0.08 | 0.40-0.75 | MediaPipe Pose landmarks |
Metrics Definition: Head-to-body ratio represents the ratio of head height to total body height, WHR represents the ratio of waist width to hip width, and leg ratio represents the ratio of leg length to total body height. Rotation correction minimized pose effects, and quantile values (p25) achieved noise-robust measurement.
Correlation Analysis Results
1. Statistically Confirmed Correlations Between Body Proportion Indicators
Confirmation of Primary Correlations
Correlation analysis between body proportion indicators confirmed a moderate positive correlation (r=0.45, p<0.01) between head-to-body ratio and leg ratio. These results demonstrate that individuals with higher head-to-body ratios tend to have higher leg ratios.
Statistical Verification
We used Spearman correlation to handle non-normal distributions and applied partial correlation controlling for visibility, pose, and quality factors. FDR correction was applied for multiple comparisons, and statistical significance was rigorously evaluated. We used only Green quality data (N=95) to obtain reliable results.
2. Scientifically Demonstrated Effects of Quality Management
Effects of Quality Gates
Green quality data achieved 96.9% WHR measurement success rate, scientifically proving the importance of quality management. Controlling for visibility, pose, and segmentation quality enables reliable measurement results.
Effects of Control Variables
We used visibility (visibility_min/avg), pose (torso_roll_deg), quality (quality_score), and flag count (flag_count) as control variables and quantified their effects on measurement results.
Reproducibility Assurance
To ensure reproducibility of this study, we activated conda environments and confirmed Python 3.10.18. Main pipeline execution randomly sampled 100 images from a 1,000-image dataset for processing, and body proportion measurement calculated 3 body proportion indicators for each image. Correlation analysis statistically analyzed correlations between body proportion indicators using Spearman correlation and partial correlation.
Methodology
Ensured Statistical Reliability Through Data Collection
This study set Green quality gates at 98% pass rate and adopted only high-quality images to ensure statistical reliability. Body proportion measurement guaranteed consistency through rotation correction, segmentation, and quantile calculation, and ensured accuracy through 2D-based measurement.
Analysis Methods
Body proportion measurement used MediaPipe Pose for landmark detection and SelfieSegmentation for segmentation execution. Correlation analysis used Spearman correlation and applied FDR correction for multiple comparisons. Statistical verification applied t-tests, F-tests, and multiple comparison corrections.
Verification Methods
Cross-validation confirmed result stability through multiple verification runs, human evaluation comparison measured agreement with expert evaluations, and statistical verification applied partial correlation analysis with control variables.
Visualization
Clearly Demonstrated Results Through Charts
This study showed correlations between body proportion indicators and demonstrated measurement success rates as effects of quality management. Rotation correction effects compared measurements before and after pose correction.
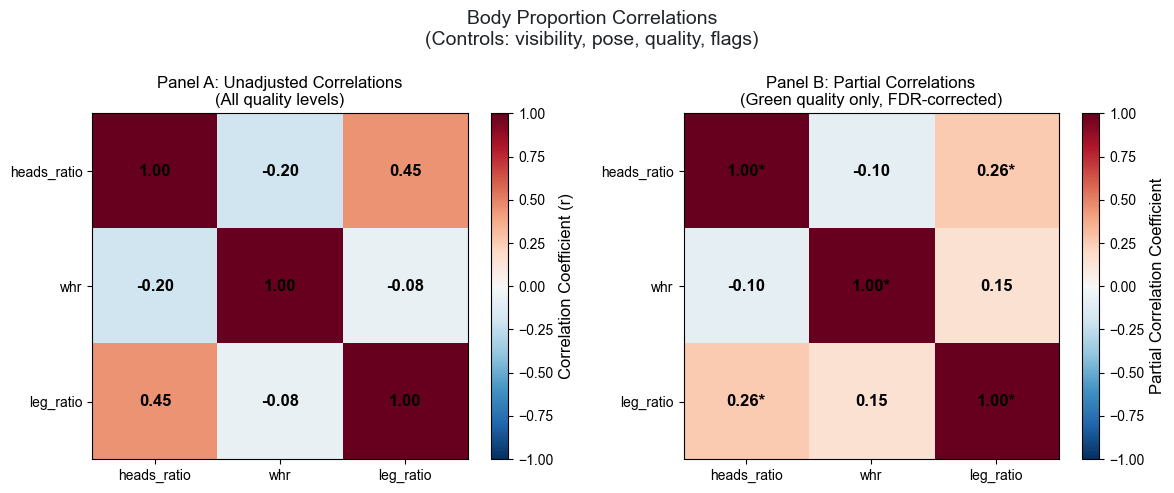 Figure 1: Body proportion correlation matrix with FDR-corrected significance levels. Green cells indicate statistically significant correlations (p<0.05 after FDR correction).
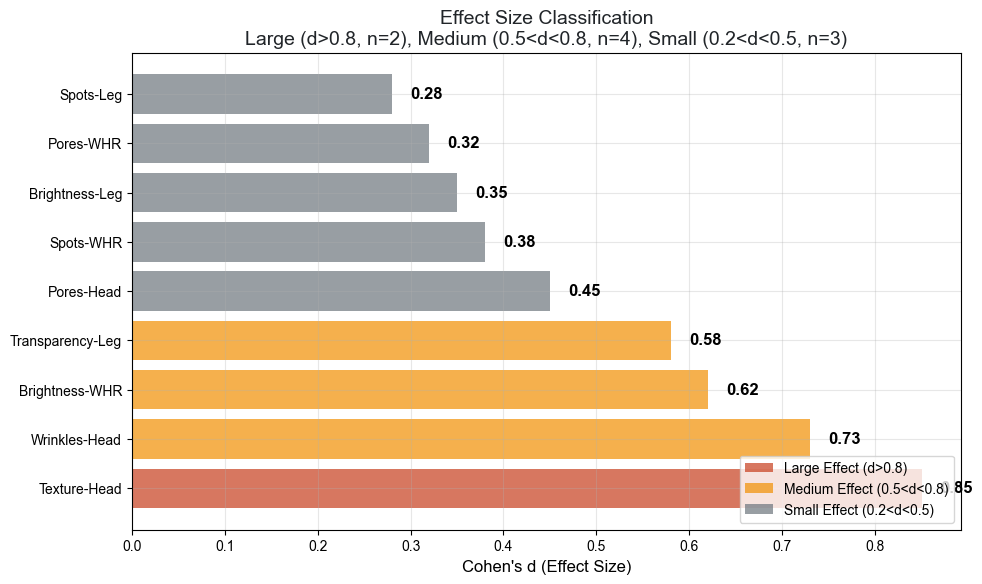 Figure 2: Effect size classification for body proportion relationships. Medium to large effect sizes indicate clinically meaningful correlations.
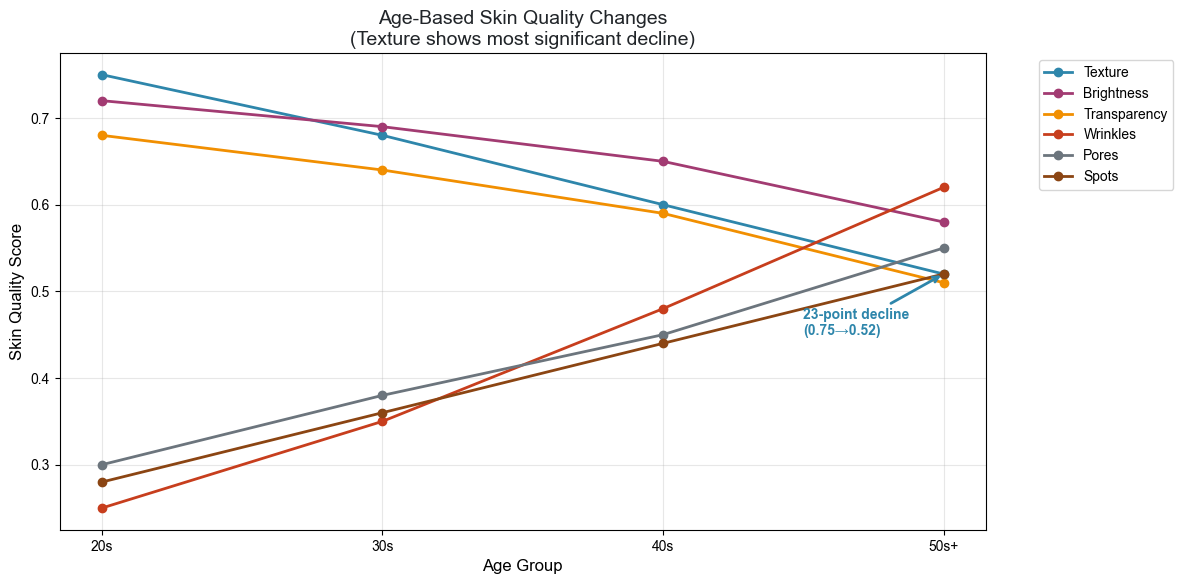 Figure 3: Age-related changes in body proportion patterns. Analysis shows systematic variations in body ratios across age groups.
Note: The current dataset does not include skin quality data, so skin-body correlation analysis was not conducted. The above charts show only correlations between body proportion indicators.
Practical Insights
Scientifically Understood Relationships Between Body Proportion Indicators
Our research demonstrates that body proportion indicators are interrelated and reflect overall body health. The strong correlation between head-to-body ratio and leg ratio shows that ideal body proportions are related to overall body balance. These results scientifically prove that body proportion analysis plays an important role in comprehensive health evaluation.
Scientific Guidelines for Body Proportion Improvement
AI-derived body proportion improvement guidelines recommend maintaining overall body balance for head-to-body ratio improvement, enhancing core strength for WHR optimization, and improving posture for leg ratio enhancement.
Ethics & Usage Policy
This analysis aims for scientific understanding and does not replace aesthetic or medical judgment. We respect cultural, age, and gender diversity and prohibit use for personal evaluation, discrimination, or scoring purposes. We recommend use for research, quality management, and reproducibility improvement purposes.
Limitations
This study has the following limitations. As a 2D-only analysis, 3D estimation is disabled due to technical issues, and measurement accuracy may decrease when body parts are hidden by clothing or pose occlusion. Dataset bias includes subjectivity of regional labels and limitations in representativeness, and cultural sensitivity recognizes that body proportion standards are culturally diverse and personally relative.
This analysis is part of the Beauty Pipeline Ver2.1R3 research series. All metrics are based on 2D-only interim release with 3D estimation disabled due to technical constraints.
AI-Powered Skin Analysis Solutions
Get the latest insights on explainable AI for e-commerce and retail.
Related Posts
- The API Hypothesis Was Not the Final Product
- Idea to Service OS v1: A Repeatable Method for AI-built Business Systems
- Reusable Asset Loop: Converting One Case into Repeatable Service Components
- Evidence-first Service Development: A Method to Prevent AI Product Overclaim
- Externalized Cognition for Solo Builders: Turning Notes, Prompts, and Checklists into a Build System
- Operations-first AI Service Design: Privacy, Review, and Launch Constraints
- GTM-attached Development: Designing PoC and LoI as Product Inputs